
Technical Analysis
Technical Analysis 101
Technical Analysis (TA) is the art and science of predicting future direction, timing, and magnitude of a market’s movement, by looking at the price changes of that market. TA is unlike Fundamental Analysis, which focuses on things like financial statements, a company’s management, their competitive advantage, supply and demand factors, and the overall economic environment.
The purists from each school of thought claim their approach is the only one that makes sense, and that the other school is completely worthless. The reality is that most traders use a combination of the two, while the goal of both approaches is the same—and that is to understand the forces of supply and demand at work in the market.
Fundamentals don’t matter much for short-term traders, because the day to day price action of stocks does not depend on things in the balance sheet, or the superiority of management, or even the company’s competitive position within its industry. Longer term investors will tell you that short term fluctuations of price are just random noise, but we know from observation of price, that buyers and sellers leave clues as to their intentions.
There are verifiable statistical edges with certain kinds of TA, but they must be applied in a contextual and disciplined fashion, because the edges are very small. There’s no such thing as a 80% edge in TA alone—even 55%, a little better than a coin flip, is uncommon.
The following statements are tru, by and large, because the vast majority of people using these TA indicators are using them without statistically verifiable data….There’s no statistically verifiable edge in oscillators, or moving average patterns. There’s no statistical edge to the common candlestick patterns. There’s statistically verifiable edge with chart patterns. The only exception to candlesticks and chart patterns are the limited studies I’ve seen conducted by Thomas Bulkowski on his The Pattern Site and his excellent books. Sadly most people don’t know this site exists. Mr Bulkowski identifies a few patterns within specific context that have verifiable edge.
The bad news is—almost everything people think works in the market, simply doesn’t. The good news is it’s possible to find an edge in the market that can lead to a consistent trading advantage. The key is understanding how patterns reveal true buying and selling pressure, and this is what provides clues to future market direction. That’s the core understanding of TA, it’s simply not possible to reduce this to a simple set of rules or patterns to be applied blindly or in some prescriptive process.
Instead of focusing on specific trading patterns or setups, let’s lay out some basic principles that drive price action in all markets and all timeframes. These aren’t foolproof rules, but they do apply universally to stocks, futures, forex, cash commodities, bonds, even cryptocurrencies…or any liquid market. These principles drive price action on one minute bars or monthly bars, so it’s fractal.
These principles are:
- Markets alternate between trends and ranges.
- Trends are more likely to continue than to end.
- When trends end, they usually end in one of two very specific ways.
After we establish these principles, I’ll show you the price patterns to look for that show support and resistance either holding or failing.
PRINCIPLE 1: Markets alternate between trends and trading ranges
This principle of market behavior is responsible for many traders losing their shirts or in the common vernacular of the times, got Rekt, because they failed to recognize the correct market context. Without this understanding you’ll place one losing trade after another.
Understanding the difference between trends and trading ranges and how the market moves between these two phases is really the first, and most important skill in technical analysis.
- When in a trading range, fading moves both up and down is the correct strategy, where the market will test support and resistance before turning back in the other direction. (Fading means to go against the current move)
- In a trend, that fading strategy will always put you on the wrong side of the market, and your losses will mount as the market moves farther and farther against you.
The goal is not being right, the goal is being on the right side of the market.
Support and resistance tends to hold in trading ranges. Ranges will contract as the market seeks out areas where selling pressure is sufficient to stop price advances, or where buying will stop declines.
Mean reversion strategies (fade trades) tend to work in trading ranges, as the market trades back and forth through the same price multiple times. It appears easy to trade ranges—just sell at resistance and buy at support and watch your account grow, right?
In reality, Trading Ranges are not that easy. Resistance may fail as the market breaks into an uptrend, putting the trader on the wrong of a new trend. If the trader adds to shorts trying to fade this new trend, losses can become dramatic.
On the other hand, there are times where resistance fails, and the market trades a little higher, establishing a new resistance area just above the old one. In this case, all that happened is the trading range expanded and the right play would be to hold, or even to add to shorts after the new resistance level has been established. The fact is that it’s much easier to identify profitable trades in trading ranges after the fact, than it is to place these trades in real time.
So, how can you tell the difference between a trading range’s movement between its upper and lower bounds, and a trend’s pull back and continuation? It’s tough, I know, and it takes practice, experience, and understanding the nuances of price action that separates trading range behavior from trend behavior.
PRINCIPLE 2: Trends, once set in motion, are more likely to continue than to end. Why do traders love to pick tops and bottoms? Because it feels good to sell the high tick in Crude Oil or to buy the bottom in a pharmaceutical stock that melts down because it was denied an FDA approval. You’ve got ego, bragging rights…But trades like this are not how you are going to build your career as a trader.
It is much easier to make money Trading trends. Trends have have more predictable structure and behavior that will keep you on the right side of the market. Also, trading the trend is more forgiving, that’s because of the power of trends, that they tend to stay in motion… so, continuation patterns allow you to be a little early, or little late on your entries, and still make profits.
So when analyzing any chart, your first thought should be,
“Ok Ernie, let’s find the trend and position myself to slay that trend.”
If you find yourself instead, always wanting to fade a trend, you’re going to either need to retrain your brain, or get an attitude adjustment, otherwise you’re going to have a short and painful trading career. I don’t know, maybe you just like to punish yourself. In this course, instead of trying to analyze moving averages or looking for chart patterns, you are going to learn the price patterns and behaviors in trends and trading ranges. Virtually all the setups and playbook trades we’ll present will be built around these things.
So, let’s examine trends in more detail: In trends, the most basic price pattern comes in three waves…an impulse move, followed by a pullback or retracement against that impulse, and then another impulsive leg that continues the original direction.
One of the best technical trades there is, comes from identifying impulse moves, and entering on the pullback, and holding the trade as the market turns back in the direction of the original move. It’s possible to build a trading career around this one very simple concept, so this is really worth a lot of your time and attention as a developing trader.

Of course, trends eventually end, and they tend to end in one of two predictable ways.
- Through lack of conviction
- Through an overabundance of conviction
Consider an established uptrend that has shown a clear pattern of impulse moves up, and retracements against the trend, with each new impulse move breaking resistance as the market trades to new highs. At some point, buyers will lose interest and the market will start to stall around resistance. Perhaps resistance will still break, but the moves through will not be as sharp or as clean as they have been.
For example, consider a pattern that has been doing $0.50 moves through resistance, then there’s a series of diminishing moves that go $0.30 and then $0.10 through resistance. We might characterize this as being a “tired market”, or we might say, if we’re trying to show off…
”a momentum divergence is emerging on the upswings.”
Resistance is taking hold of the trend, and eventually the trend will end.
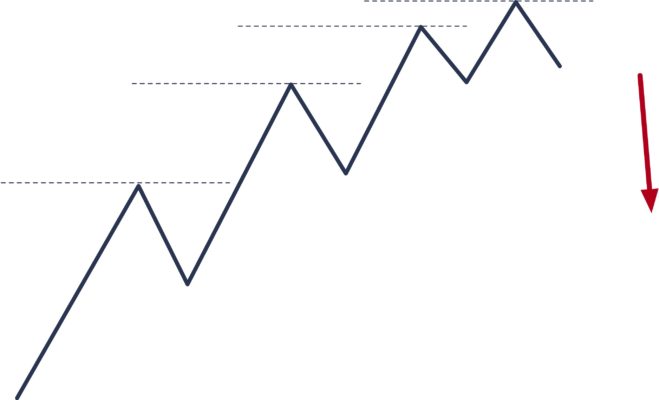
This is the quiet and polite way for trends to end, but trends can also end in much more dramatic ways.
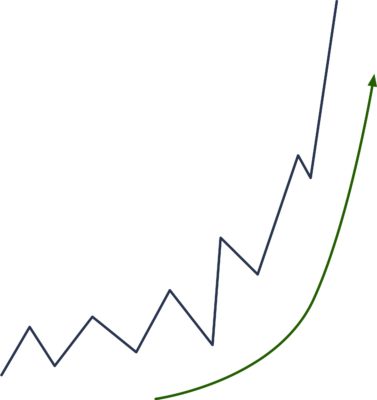
Take the case where price accelerates into a series of more and more dramatic up-moves and goes “parabolic.” Emotions fly in a move like this (which is why you, as a successful trader, must learn to control your emotions). It looks like the market is going straight to the moon. At some point, the last willing buyer has bought and a vacuum has formed on the other side. The market immediately collapses as bulls, who were feeling giddy just moments ago, are now panicked, as they realize they’re caught on the wrong side of the trend.
Let’s, imagine you successfully caught the top in that last blowoff trend. Now what?
It’s possible that the uptrend will turn into an equally dramatic downtrend (anything is possible at any time in the market), but remember our first principle of market behavior:
- Markets alternate between trends and ranges.
It is far more likely that the top you caught will now lead to a sideways trading range than an actual trend reversal.
Your emotional and financial capital will now be tied up in an unproductive trading range as you agonize over each tick. Once you are in that trading range, you’re stuck, you’ll probably be waiting to see if it will break out into a continuation of the original trend, or reverse, and start a new trend in the other direction.
There is money to be made here, but it is hard money.
Let’s get back to Trading Ranges…
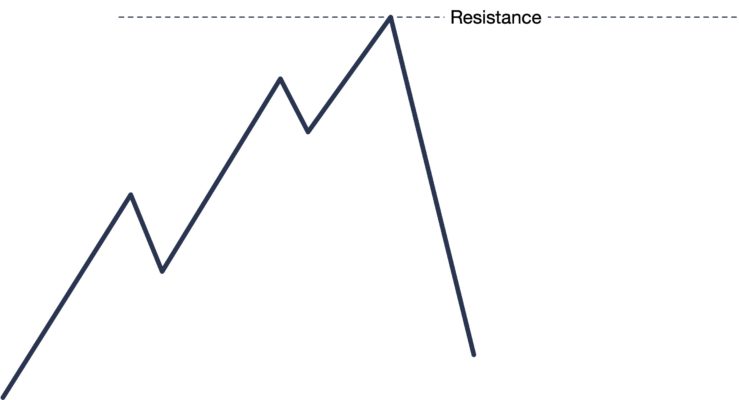
In trading ranges, you need to know how price acts around support and resistance. The characteristic pattern is “price rejection” at those levels. Price trades near the level, and then immediately is pushed away in a sharp momentum move.
Note that support and resistance levels do not have to hold cleanly. In fact, some of the best tests occur when price slightly penetrates the level, but there’s a lack of conviction beyond the level. (This obviously has implications for where you might set your stops. It’s unwise, in most cases, to stop out a tick beyond S/R, if you do, you have to be prepared to re-enter if a level is penetrated and immediately fails.)
This is not always how support and resistance holds, but this should be your basic mental template.
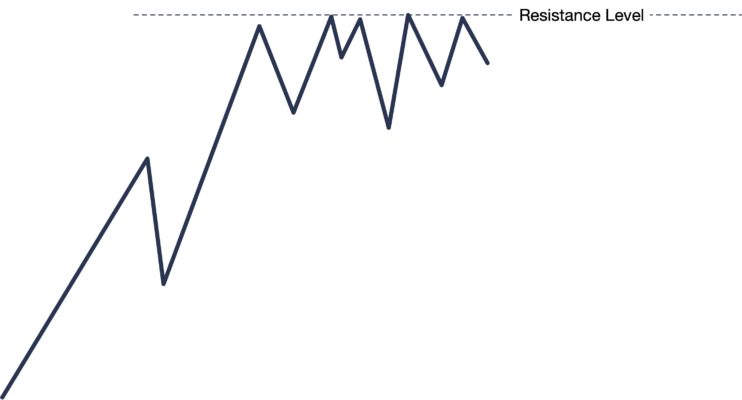
If price goes quiet at the level, this is more indicative of impending failure. Buyers are either able to hold the market near resistance as they accumulate more inventory, or sellers keep enough pressure on the market to keep it sitting on support.
If you sell a test of resistance and the market does not back off very much, you probably should think about scratching the trade (taking either a very small win or loss.)
If you see a market sitting quietly on support for a while, it may be that this boring price action causes the public to lose interest, however we know that this kind of action can also set up a dramatic break of that level.
This is an illustration of our first principle of price behavior in action. The quiet trading range at support often gives rise to a dramatic trend below support.
It pays to pay attention to quiet markets sitting near important levels. This contradicts one of the time-honored principles of technical analysis, which is that a level is more valid the more times it is tested. In general, a good level should have the power to push prices immediately away from the level. If we see it back at the level three or four times, start thinking “we shouldn’t be back here,” and consider the possibility of a breakout trade.
The purpose of this lecture has been to introduce you to the basic concepts that drive price behavior in all markets and all timeframes. To recap:
- Markets alternate between trends and trading range.
- A trend is more likely to continue than to end.
- Trends tend to end in one of two ways: rollover or dramatic blowoff tops.
- If support or resistance are going to hold, there is usually price rejection at the level.
- Conversely, the market going quiet and trading near the level more often precedes failure of the level.
All of our patterns and setups revolve around one of these four basic price actions. And the trades that might set up or the way they are managed will depend how the market evolves, the specific context. Your job as a trader is to understand this context, so that you know which of these price behaviors is in play so that you enter the correct trades, and manage the risk.
Great post, can’t wait for the course.